
Metrics Overwhelm: You're Measuring Everything and Learning Nothing
This is a Complete Guide to help you understand Metrics when You Have All the Data and No Answers

“Not everything that counts can be counted, and not everything that can be counted counts.”
— Albert Einstein

Agile teams often have no shortage of metrics.
Examples:
Velocity. Sprint burndown. Cycle time. Lead time. Throughput. Defects. Escaped defects. Story points completed. Predictability. Deployment frequency. Customer satisfaction. Feature adoption. NPS. OKR progress. Roadmap confidence. Team happiness. Support tickets. Revenue impact. Conversion rate. Churn.
The problem is not the lack of data. Agie teams have a lot of it.
The problem is that they have too much disconnected data, which means they don’t have a shared understanding of what that data is supposed to help them decide.
This is the situation where metrics are discussed without changing anything. Everyone can point to numbers, but nobody is sure what they mean or whether they matter.
That is metrics overwhelm.
And it is dangerous because it makes a team “appear” data-informed without helping the team make better decisions.
If you’re new, then you missed the posts below in the past few weeks
How to deal with part time team members with split allocations
How would I help my team resolve impediments without depending on me?
Here’s what “metrics overwhelm” looks like
You may recognize metrics overwhelm when conversations sound like this:
“Our velocity is down, but our throughput is up. Is that good or bad?”
“The dashboard says we’re behind, but the team says things are fine.”
“Leadership wants more predictability, so we added more metrics.”
“We measure customer adoption, but nobody knows what adoption level would count as success.”
“We report sprint completion every two weeks, but the product decisions are still based on stakeholder pressure.”
“We have all the data in Jira, Productboard, GA, Amplitude, Power BI, and spreadsheets, but we still don’t know what to prioritize.”
The team collects metrics at three different levels, but mixes them together:
Delivery metrics: Are we delivering work smoothly?
Product metrics: Are users benefiting from what we deliver?
Business metrics: Is the organization getting the result it needs?
Each category is useful. But confusion begins when people expect one type of metric to answer another type of question.
Velocity cannot tell you whether customers value the feature. NPS cannot tell you whether the team has too much work in progress. Revenue cannot tell you whether your refinement process is healthy. Cycle time cannot tell you whether you are solving the right problem.
When the metric is used to answer the wrong question, the conversation becomes confusing.
Why does metric overwhelm happen?
The simple answer is UNCERTAINTY.
Metrics overwhelm usually happens because people are trying to reduce uncertainty.
Product work is uncertain. Agile delivery is uncertain. Stakeholder expectations are uncertain. Customer behaviour is uncertain. Technical complexity is uncertain.
So teams and leaders reach for measurement to build confidence.
The problem is that metrics are often added one by one, without removing old ones and without clarifying their purpose.
For example:
A stakeholder asks for a delivery forecast, so velocity gets reported
Leadership wants confidence in outcomes, so OKR dashboards are added
Customer success raises concerns about complaints, so support metrics are included
Engineering wants to improve flow, so cycle time and work-in-progress are added
Product executives want evidence of value, so adoption and conversion data get added
None of these is bad on its own. In fact, most are reasonable.
But together, without a decision framework, they become cognitive clutter.
The team ends up with a pile of signals but no way to separate what is important from what is merely available.
What’s a useful metric?
A useful metric should help someone make a better decision.
If a metric does not influence a decision or trigger a conversation, or guide an experiment, it is probably not a useful metric.
One of the questions you can ask your team is:
“What decision will this metric help us make?”
If nobody can answer, pause before adding it to the dashboard.
For example:
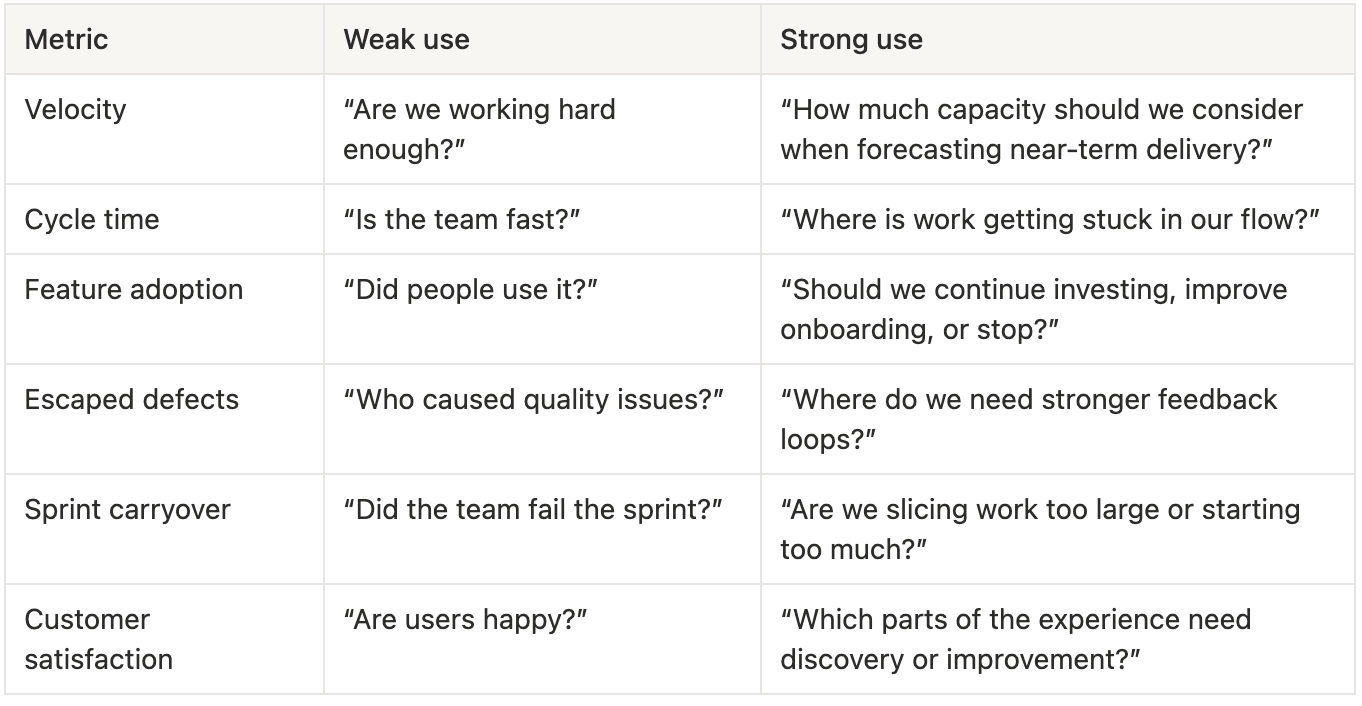
The metric itself is not the insight.
Insight comes from interpreting the metric in context and deciding what to do next.
Got an urgent question?
Get a quick answer by joining the subscriber chat below.

How Product Owners get overwhelmed by metrics
For Product Owners, metrics overwhelm often shows up as pressure to prove progress.
Stakeholders want to know:
Are we on track?
When will this be done?
Is the team productive?
Are customers using what we built?
Are we getting value?
Why is this taking so long?
Why did priorities change?
In response, the Product Owner collects more and more data to defend decisions.
For Example:
Roadmap status. Sprint completion. Feature delivery dates. Stakeholder requests fulfilled. Adoption curves. Revenue targets. Backlog size. Dependencies. Team capacity.
But a Product Owner’s job is not to produce enough metrics to satisfy everyone’s curiosity.
Their job is to create enough CLARITY to support better product decisions. That means the Product Owner needs to distinguish between:
Metrics for transparency
Metrics for learning
Metrics for prioritization
Metrics for accountability
Metrics for improvement
The above metrics are not the same.
A roadmap confidence metric may help stakeholders understand uncertainty.
A feature usage metric may help the Product Owner decide whether to iterate.
A cost-of-delay discussion may help prioritize backlog items.
A cycle time metric may help the team improve flow.
A business outcome metric may help evaluate whether the product strategy is working.
When all of these are thrown into a single dashboard without a clear intent, the Product Owner becomes a curator of confusion.
How Scrum Masters get overwhelmed by metrics
For Scrum Masters, the danger is slightly different.
Scrum Masters often care deeply about team health, flow, continuous improvement, and transparency.
Metrics can be very helpful here. But they can also become a subtle form of micro management if not handled properly.
For example, a Scrum Masters often introduce:
Velocity patterns
Sprint predictability
Burndown charts
Cycle time
Blocker count
Work item aging
Team happiness
Retrospective action completion
Defect trends
The above metrics can support excellent conversations.
But if the team feels the numbers are being used to judge them, they will adapt their behaviour to protect themselves.
For example they may:
Inflate estimates
Split stories artificially
Avoid complex work
Stop raising blockers
Push defects out of sight
Metrics should help the team see the system more clearly, not make individuals feel watched.
So how do we handle this?
The best way to escape Metrics Overwhelm is by clarifying the decisions first.
Start by asking:
“What decisions do we need to make on a regular basis?”
For an agile product team, these might include:
What should we prioritize next?
Should we continue, pivot, or stop an initiative?
Are we ready to release?
Is our delivery system improving?
Are we carrying too much work in progress?
Are customers getting the expected value?
Are stakeholders being given a realistic view of progress?
Do we need to invest in quality, discovery, or technical health?
Is the team overloaded?
Is this product bet working?
Then, for each decision, identify the smallest set of metrics that can inform it.
For example:
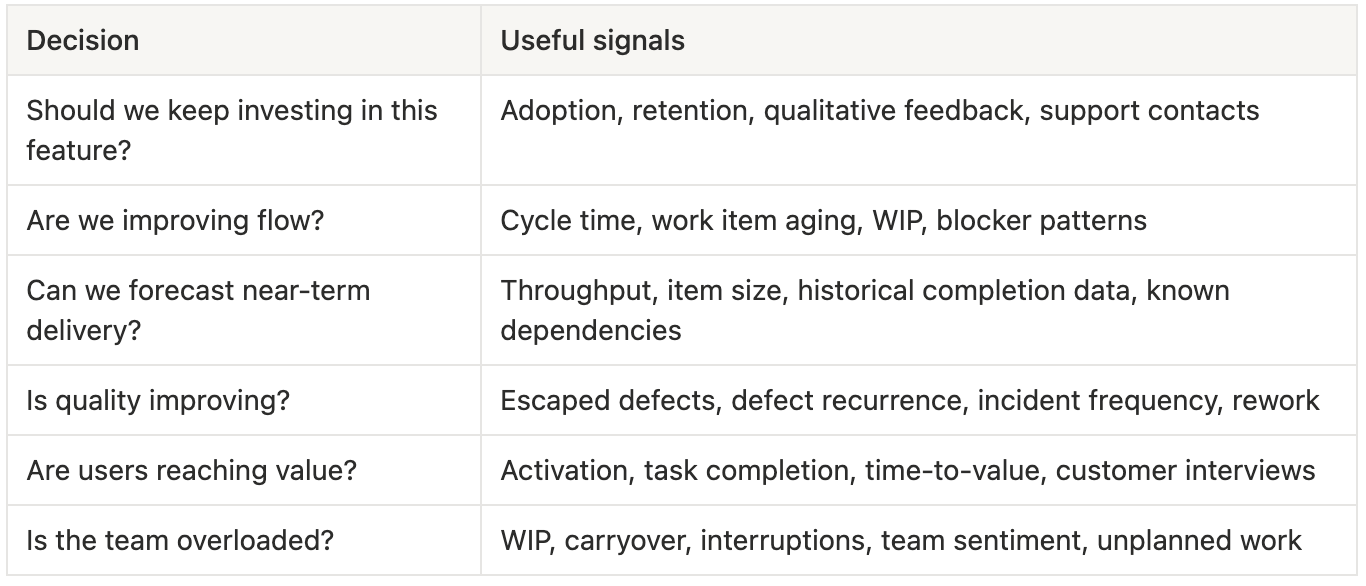
This approach prevents the collection of metrics that serve no purpose.
Use a “metrics menu,” not a metrics buffet
If you have ever had a buffet at a restaurant, you know that buffets encourage people to pile everything onto the plate.
A menu forces choice.
Agile teams benefit from a small, intentional set of active metrics, which may change depending on the team’s focus.
Below are a few examples of such a metric menu:
#1: If the team is struggling with the delivery flow
Focus on:
Cycle time
Work in progress
Blocked work
Work item aging
Throughput
Do not over-focus on:
NPS
Long-term revenue
Brand metrics
Large business lag indicators
Those may still matter, but they are not the immediate requirement for improvement.
#2: If the team is validating a new product idea
Focus on:
Customer interviews
Experiment results
Activation
Feature engagement
Conversion through the target behavior
Do not over-focus on:
Velocity
Story points completed
Sprint commitment accuracy
The goal is learning, not maximizing output.
#3: If the team is improving quality
Focus on:
Escaped defects
Rework
Incident frequency
Defect cycle time
Customer complaints related to quality
Do not over-focus on:
Number of features shipped
Velocity increases
Roadmap volume
The goal is to restore confidence and reduce the demand for failure.
#4: If the team is scaling stakeholder trust
Focus on:
Forecast accuracy ranges
Roadmap confidence levels
Dependency visibility
Outcome progress
Decision latency
Do not over-focus on:
Individual productivity
Hours worked
Raw ticket count
The goal is better alignment and expectation management.
Separate health metrics from target metrics
One distinction is between target metrics and health metrics.
Target metrics
These represent what you are actively trying to improve.
Examples:
Increase activation
Reduce onboarding drop-off
Improve cycle time
Reduce escaped defects
Increase trial-to-paid conversion
Reduce customer churn
Improve forecast reliability
These metrics are central to business decisions.
Health metrics
These are things you monitor to make sure improvement in one area is not damaging another.
Examples:
Team morale
Defect rate
Customer complaints
System performance
Support volume
Work in progress
Technical debt indicators
For instance, if the target is to increase feature delivery speed, quality and team health should become health metrics. Otherwise, the team may “succeed” by burning people out.
If the goal is to reduce defects, delivery throughput may become a health metric; otherwise, quality improvement could lead to paralysis.
This distinction helps reduce overwhelm because not every metric gets equal attention.
Some metrics are steering the current change.
Others are guardrails.
How to turn metric data into insight
Data becomes insight when it changes understanding.
Here’s how the progression happens:
Data: “Cycle time increased from 4 days to 9 days.”
Information: “The increase is mostly in review and testing.”
Insight: “Stories are reaching review before acceptance criteria are clear, causing rework.”
Action: “We will improve refinement and add earlier QA/product review.”
Learning: “If review wait time drops, we know the change helped.”
Many teams stop at step 1 or 2.
They display the data and assume the insight is obvious.
It usually is not.
Here, Scrum Masters can add huge value by facilitating the movement from number to meaning to action.
You can ask questions like:
Is this a one-off or a trend?
What changed in our system recently?
What decision does this affect?
What would we do if this metric got worse?
What would we do if it improved?
What qualitative evidence do we need?
Who can help interpret this?
What experiment should we try?
Qualitative insights
Metrics tell you what is happening.
They often cannot tell you why it is happening.
For instance, if activation is low, analytics may show where users drop off. But they may not explain whether users are confused, unconvinced, distracted, lack permissions, are using a workaround, or are solving a different problem entirely.
If the velocity drops, Jira may show fewer story points completed. But it may not explain whether the issue is unclear priorities, technical debt, dependencies, interruptions, illness, low morale, or overcommitment.
This is why metrics should be paired with qualitative learning:
For example:
Customer interviews
Usability testing
Sales and support conversations
Retrospectives
Stakeholder interviews
Team health checks
Observation of real user behavior
etc
You don’t have to choose between data and conversation. Use data to focus the conversation.
Metric Purpose Statement
For each metric you keep, define a short purpose statement.
Use this format:
We measure [metric] to understand [question] so that we can decide [decision/action].
Examples:
We measure cycle time to understand where work slows down so that we can improve flow and reduce unnecessary waiting.
We measure feature adoption to understand whether users are trying the new capability so that we can decide whether to improve, promote, or stop investing in it.
We measure escaped defects to understand where quality issues reach customers so that we can strengthen our feedback and testing practices.
We measure team sentiment to understand whether our way of working is sustainable so that we can address overload before it becomes burnout.
We measure activation rate to understand whether new users reach first value so that we can improve onboarding and early product experience.
If you cannot complete the statement, the metric probably does not belong in the active dashboard.
How to clean the current metrics you have
Conduct a workshop with the Product Owner, Scrum Master, Developers, and relevant stakeholders.
Step 1: List your current metrics
Collect every recurring metric the team reports, reviews, or tracks.
Do not debate yet. Just list them.
Step 2: Mark the audience
For each metric, identify who it is for:
Team
Product Owner
Scrum Master
Stakeholders
Leadership
Customers
Operations
Other teams
Step 3: Identify the decision
Ask:
“What decision does this metric support?”
If the answer is unclear, mark it.
Step 4: Identify the action threshold
Ask:
“When would this metric cause us to act?”
For example:
If the cycle time increases for three consecutive weeks, we investigate blockers
If adoption is below target after launch, we run customer interviews
If the number of escaped defects increases, we review testing and release practices
If WIP exceeds the agreed limit, we stop starting and start finishing
Step 5: Remove, archive, or downgrade
Not every metric needs to be deleted.
Some can be:
If a metric helps us make a current decision, keep it active (Eg: Cycle Time)
If it protects us from side effects, make it a guardrail (Eg. Escaped defects)
If it helps us investigate a problem, keep it diagnostic (Eg. Time spent in each workflow status)
If it has historical value, archive it (Eg. Adoption of last quarter’s reporting feature)
If nobody uses it, remove it (Eg. Number of backlog items created)
This gives the team permission to stop carrying old measurement habits forever.
The honest truth about Metrics
Data doesn’t create clarity on its own. Clarity comes from a team that has agreed on what they’re trying to achieve, identified the signals that show whether they’re getting there, and built the habit of talking honestly about what those signals mean.
Metrics are a language.
And like any language, they only communicate something when both parties understand the words.
Further Reading
Connect With Me
Winning Strategy provides insights from my experiences at Twitter, Amazon, and my current role as an Executive Product Coach at one of North America’s largest banks.